Working from home for the past 7+ months has left me with strong urges to get out and about on the weekends, least I go crazy from being coped up inside – whilst my inner geek urges to sit infront of my laptop and code are strong, getting outside for a walk, seeing new places and new people always puts me in a better mind set for when I get home to do a large coding session in the evening afterwards. ;-)
The last two weekends I’ve done the Takapuna to Devonport (Green Route) walk, a pathway I discovered purely by chance whilst walking to Devonport along the main road route due to an entrance onto a park just at the start of the memorial WW2 tree-lined road half-way in my journey.
It takes you through a number of parks that I didn’t even know existed, over the marsh lands and through some of the older streets towards Devonport with characteristic turn of the century houses (Devonport being established as a suburb around 1840 and one of Auckland’s older suburbs).
There’s a handy map you can download from the council here and the whole route is walk & cycle safe. It’s certainly the better route to take, the road route between Takapuna and Devonport should be avoided at all costs, considering it’s always congested and overloaded with traffic, as there is only one road route from Devonport all the way up to Takapuna in order to get onto the motorway.
Having made the mistake of trying to drive to Devonport once before, I’d avoid it at all costs, you’d get from Devonport to Takapuna faster by taking the ferry to Britomart and bus from there IMHO, nose-to-tail traffic the whole way on a Sunday evening isn’t that fun, not to mention a nightmare finding car parking in Devonport itself.

Traffic backed up from the Esmond Rd - Lake Rd junction. It's like this for a good suburb or two, even on weekends. :-/

The sane way for non-car loving Aucklanders to get around.
The route signage is pretty good, although I found that whilst Devonport-to-Takapuna was almost perfect in directional signage, the Takapuna-to-Devonport approach has a few bits that are a little confusing if you hadn’t done it the other way first.
There’s also a complete nightmare in terms of cycle vs pedestrian marking, something that the North Shore City Council loves doing, such as alternating conventions of left vs right side for cyclists – something I’ll cover in a future post. :-/
The route doesn’t seem particularly busy, most of the activity I saw was with people in the various parks the route crosses through, rather than others completing the same route as me – I expect the length detours them a bit (took me around 1.5hrs).
Starting from Takapuna/Esmond road, the route is firstly though the newer suburbs of Takapuna, with a weird suburban/industrial mix of some lovely power pylons running along the street.

Ah, the serenity! :-D
TBH, Takapuna suburbs bore me senseless, they’re a giant collection of 1970s-2012 housing projects, very American-dream type feel at times. Thankfully one soon escapes to the parks and walkways along the marshy coast.

Marshy land, Auckland Harbour bridge in the distance.

One of several boardwalks so you won't get your feet/wheels muddy - unless you want to. :-)

Long bridge is long! (kind of reminds me of Crash Bandicot's Road to Nowhere). If the ground is dry, you could brave cycling alongside it through the marsh, few tracks suggesting this is somewhat popular.
The route slowly starts getting more parks and greenery, with small intermissions of going back along suburb streets, before rejoining more natural routes.

Got a skateboard? And a hoodie? This is the place for you to hang in this otherwise quite empty grassy field called a park.

/home/devonport_residents/.Trash/ (that's a recycling bin joke for you windows users!)
Once you come out of the park, you end up walking through a few blocks of Devonport’s residential area, before coming out onto the main street and along to the shopping and cafe area.

An old church, where Aucklanders worship their god "Automobile".
I quite like Devonport, it has a good number of cafes, bars, the waterfront, classic architecture (not bland corporate crap like Takapuna) and generally has charm.
If I was going to live in Auckland long term, I’d seriously consider Devonport as a good place to have house, I’d even consider not bothering with a car, depending on the availability of a good close supermarket.
Of course this assumes working in the CBD or from home, so you can just take the ferry into the CBD, rather than needing to mess around with commuting up to the motorway and into the city everyday. If a car-based commute is vital, you might want to do Devonport a favor and go live in a less classy suburb with closer motorway access.

Knitted handrails! This place has style!

Vertical water accelerator.
I stopped for a coffee at one of the several cafes around the main street with an outside area and was pleasantly surprised for a change – I didn’t even see a Starbucks there!
The local residential population appears to have a lot of members of the baby boomer generation and either residential or visiting families attracted to the parks and waterfront.
As I was there, I decided to make the short climb up Mt Victoria (*curses settlers who named about 50 million places in NZ Mt Victoria*) and get a good look out over the area. In typical Auckland fashion, it is entirely possible to drive right up to the top, or take a segway tour, but despite the name it’s really just a medium sized hill, nothing compared to Wellington stuff.

Looking out towards Okahu & Mission Bay. Start to get an idea why Auckland is the "City of Sails".

Our old friend Rangitoto island again. Incidentally, Mt Victoria itself is also a volcano, just not anywhere nearly as large.

Looking out over houses towards North Head,

Auckland CBD

Panorama out towards Rangitoto

Panorama showing Auckland CBD on left, Devonport centre and Takapuna in the horizon on the right.
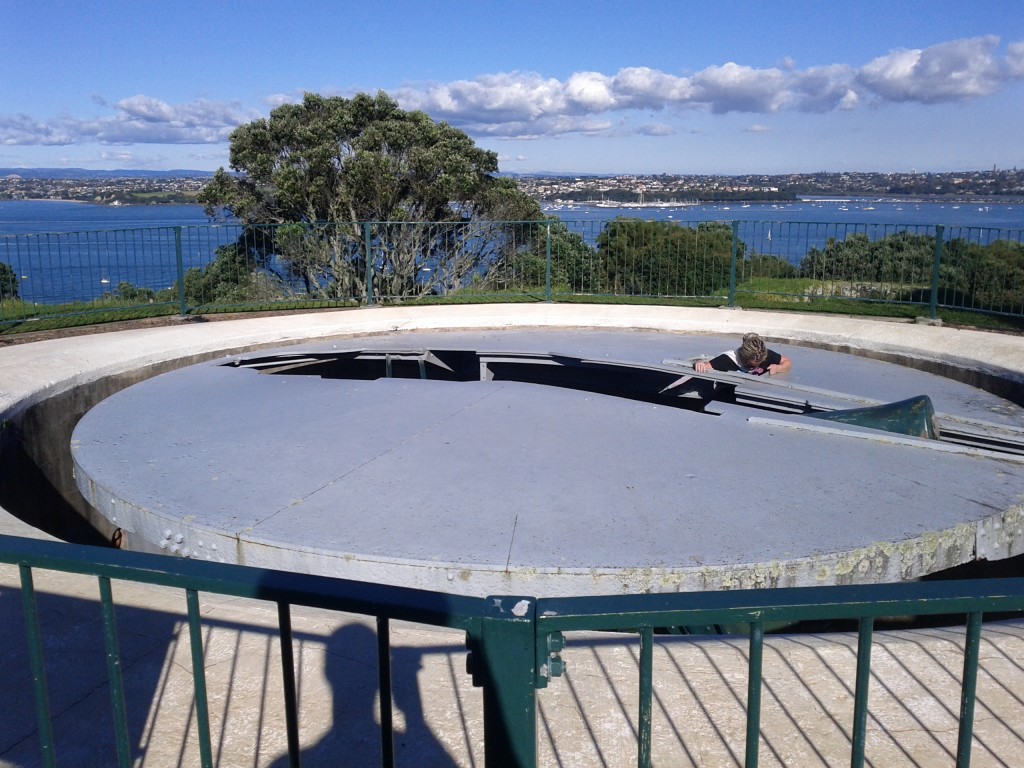
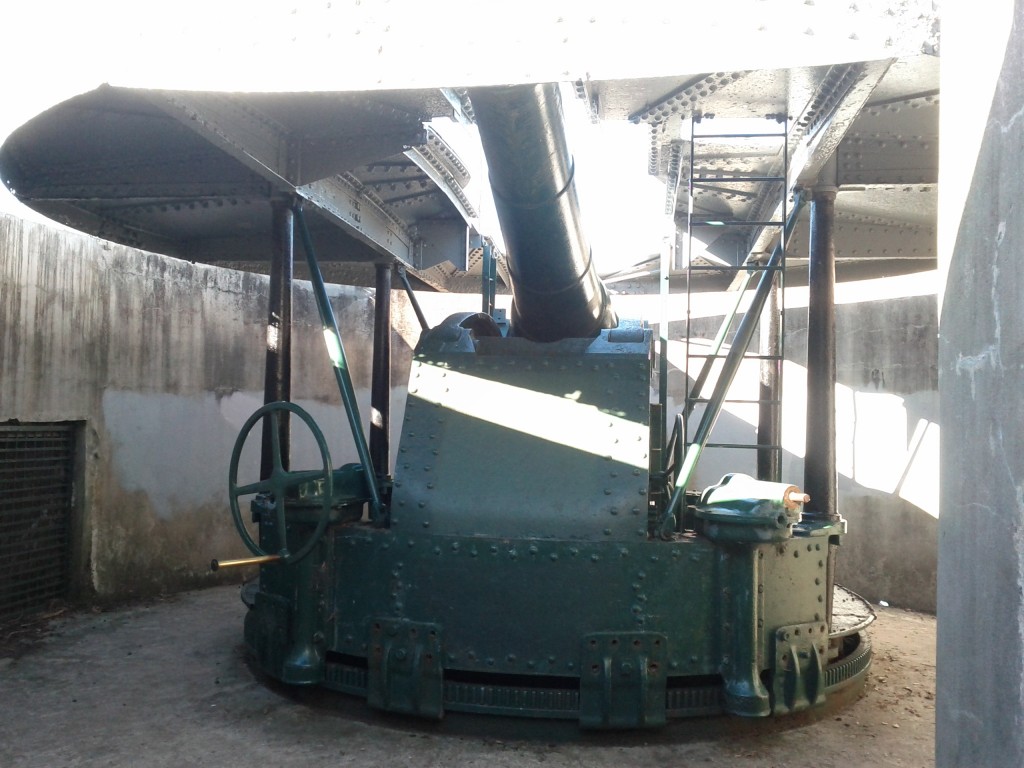
I didn’t know anything about it other than it was a big hill, so damn I was going to climb and conquer that, but it turns out it was part of Auckland’s early military history with a large disappearing gun (BL 8 inch Mk VII naval gun) which was installed in 1899, well before WW2 – seems NZ has a number of good examples of these interesting pre-WW1 weapons.

The magical disappearing cannon!

Fuck being the poor suckers who had to lug this all the way up the hill. :-/

Mushroom vents hint to a large underground complex - sadly closed to the public.
One thing I missed is the other large hill in the area – North Head – which offers a much larger selection of 1800’s – WW2 relics including tunnels and additional guns which are open to the public.
Devonport has had a long military history and is where the main naval base of New Zealand, dating back to 1841, usually has a couple ships berthed to look at – or sometimes coming/going offering some neat photo opportunities.
I tend to find that Auckland really hides it’s interesting stuff, I lived in Takapuna for months before I discovered the existence of many of these interesting walkways and sights, in many cases they just aren’t advertised and from a distance, you don’t get an idea of how interesting some of these places can be. (Mt Victoria and North Head look just like plain hills with some sheds on them from sea level).
That’s why I love exploring on foot, find so many gems, look them up online, find another 5 related ones to go and check out. :-) And don’t be afraid to take random interesting looking paths to see where they lead, it’s how I find many places – including many of Wellington’s paths and walkways.
After the trip up Mt Victoria, I wandered back down and along the waterfront – turns out it’s a fantastic place to get close up shots of any large ships passing by.

Rena-sized cargo ship, gives an idea how massively large these things are when seeing up close. See the little speedboat to the right for an idea of the size difference. :-D
I ended up heading to the ferry terminal to get the ferry over to Britomart to catch up with friends, only took less than 15mins to board and cross over the harbor for $6. (frequent traveler discounts available).

This is Fuller Ferry, requesting Devenport wharf command center to lower defence grid for safe docking.

Cruising in to the Britomart ferry terminal, past the Rugby Word Cup "Cloud" event center.
Finally wrapped up the day with a delicious coffee and snack at my much loved Shakey Isles before they closed (closing time is 17:00 on weekends FYI).

Om nom nom (totally not addicted to chocolate)
If you don’t live in Takapuna and want to reproduce this walk, I’d recommend taking the Northern Express (NEX) bus to Akoranga Station, or the normal Takapuna buses to the shopping center, doing the walk to Devonport and then ferry back into Britomart.
It’s an easy day trip and could be as short as 3-4 hrs or as long as an entire day depending what sights and coffee you decide to partake in whilst at Devonport.
The other approach is to do Takapuna – Devonport & return, something that might appeal particularly if wanting to do it by bike rather than foot, there’s a bit more parking around Takapuna, particular Fred Thomas drive area near Akaranga Station to drive to with your bikes.


