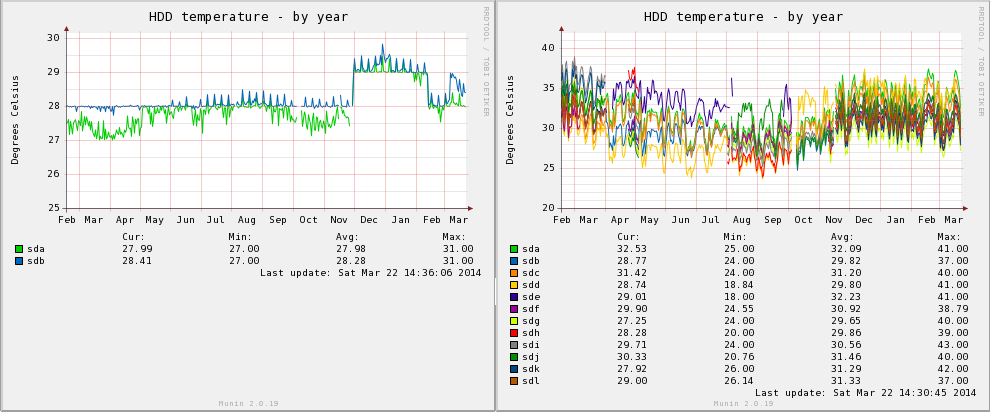
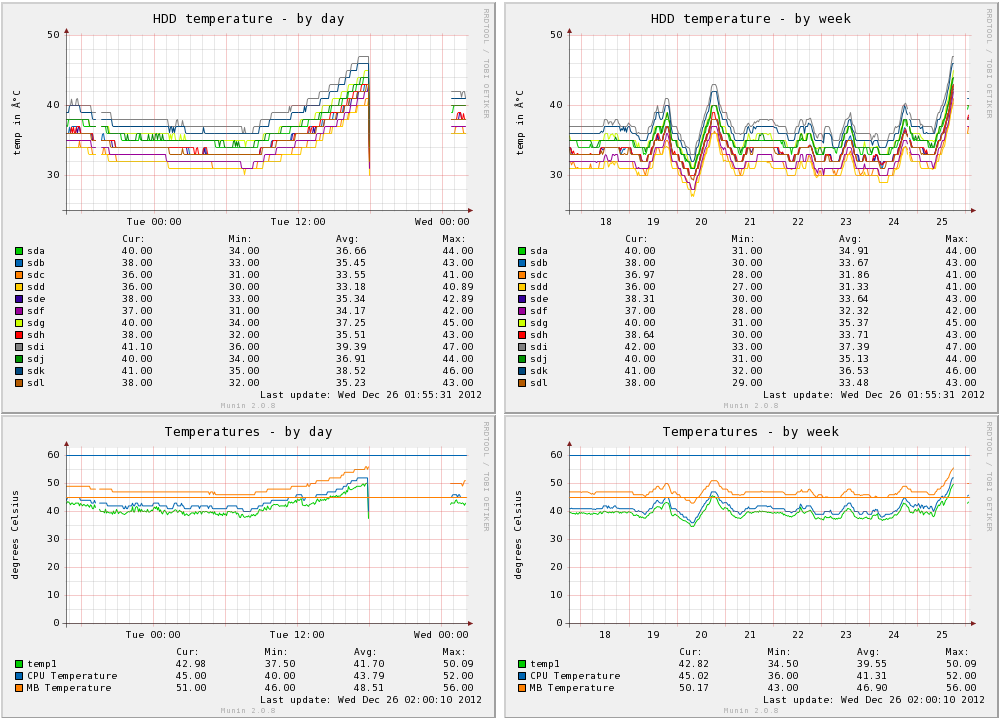
I always like reviewing the Munin temperature graphs between my co-located server and my home server, the temperature range fluctuations in non-air conditioned rooms is always quite interesting – as much as 25 degrees Celsius over the course of the year, inline with the seasons.
Tag Archives: munin
Holy Relic of the Server Farm
At work we’ve been using New Relic, a popular software-as-a-service monitoring platform to monitor a number of our servers and applications.
Whilst I’m always hesitant of relying on external providers and prefer an open source solution where possible, the advantages provided by New Relic have been hard to ignore, good enough to drag me away from the old trusty realm of Munin.
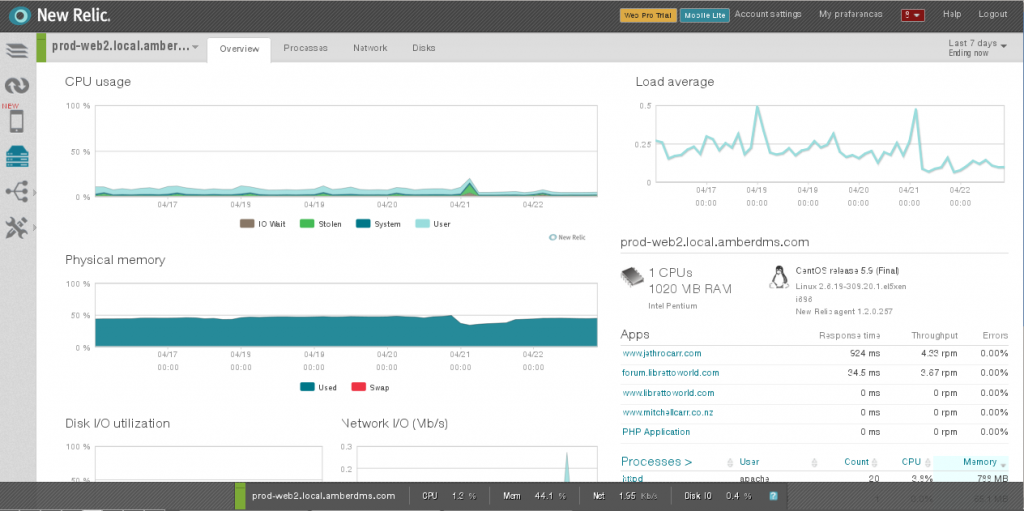
Like many conventional monitoring tools (eg Munin), New Relic provides good coverage and monitoring of servers, including useful reports on I/O, networking and processes.
However where New Relic really provides value is with it’s monitoring of applications, thanks to a number of agents for various platforms including PHP, Ruby, Python, Java and .NET.
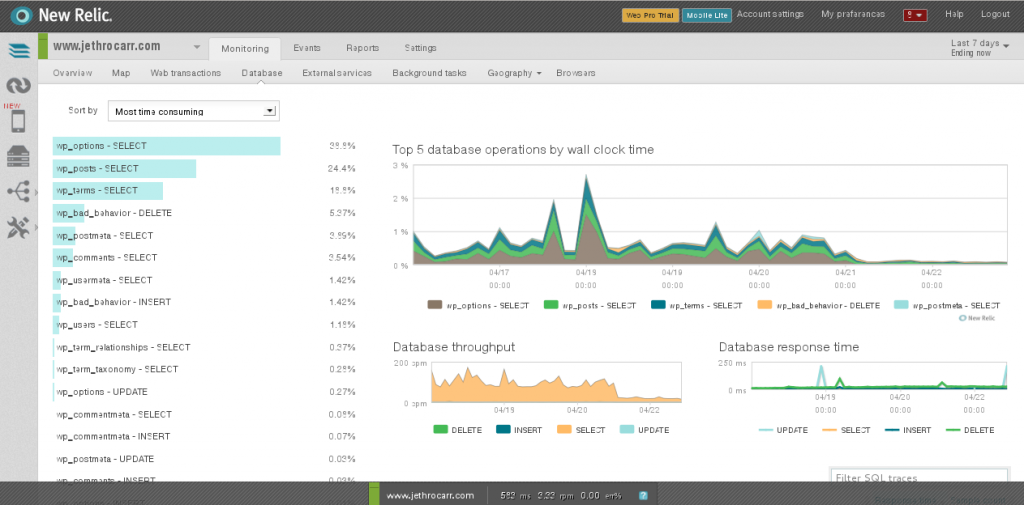
These agents hook into your applications and profile their performance in detail, showing details such as breakdown of latency by layer (DB, language, external, etc), slow DB queries and other detailed traces.
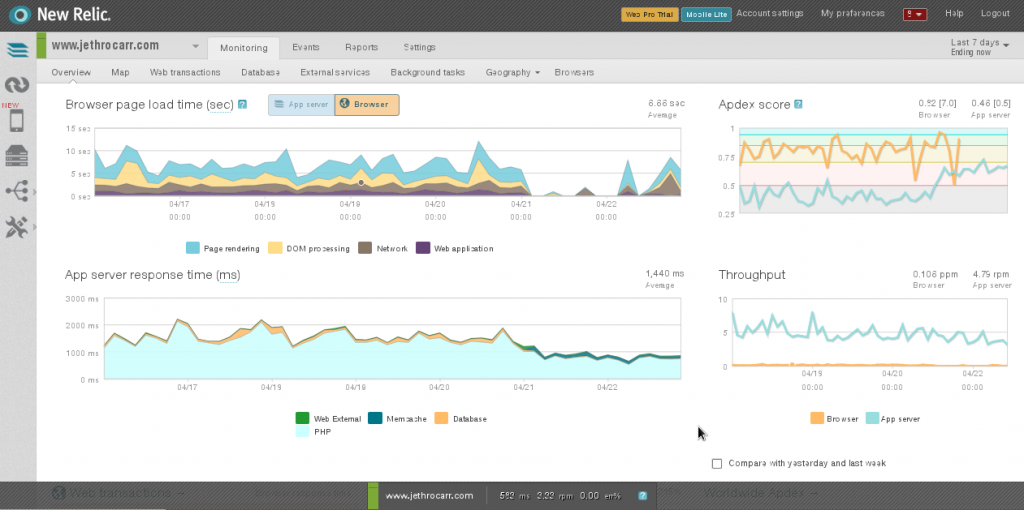
For example, I found that my blog was taking around 1,000ms of processing time in PHP when serving up page content. The VM itself had little load, but WordPress is just not a particularly well oiled application.
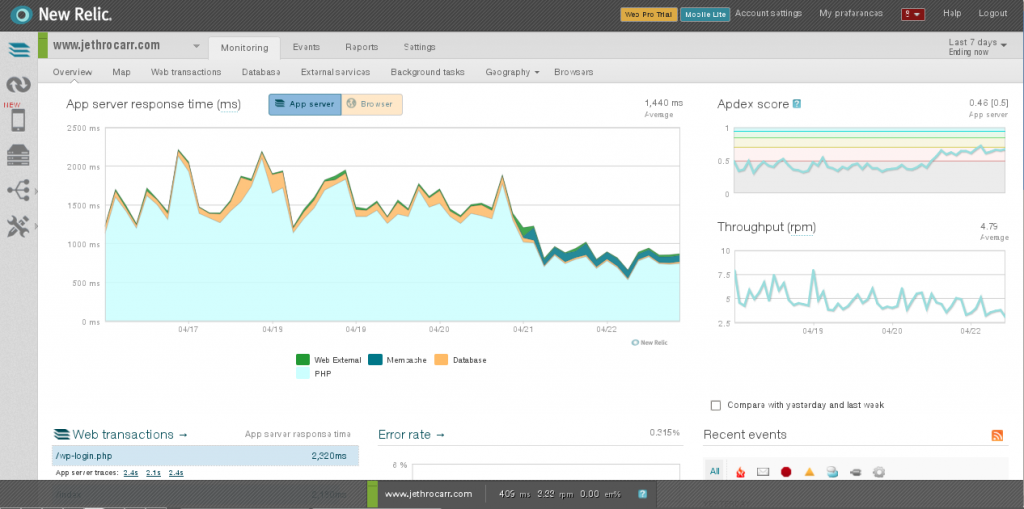
Before and after installing W3 Total Cache on my blog. Next up is to add Varnish and drop server times even further.
New Relic will even slip an addition into the client-side content which measures the browser-side performance and experience for users visiting your website or application, allowing you to determine cause of slow page loads.
There’s plenty more offered, I haven’t even looked at all the options and features yet myself – best approach is to sign up for a free account and trial it for a while to see if it suits.
New Relic recently added a Mobile Application agent for iOS and Android developers, so it’s also attractive if you’re writing mobile applications and want to check how they’re performing on real user devices in the wild.
Installation of the server agent is simply a case of dropping a daemon onto the host (with numerous distribution packages available). The application agents vary depending on language, but are either a case of loading the agent with the application, or bundling a module into your application.
It scales well performance wise, we’ve installed the agent on some of AU’s largest websites with very little performance impact in most cases and the New Relic interface remains fast and responsive.
Only warning I’d make is that the agent uses HTTP by default, rather than HTTPS – whilst the security impact is somewhat limited as the data sent isn’t too confidential, I would really prefer the application use HTTPS-only. (There does appear to be an “enterprise security” mode which forces HTTPS agents only and adds other security options, so do some research if it’s a concern).
Pricing is expensive, particularly for the professional account package with the most profiling. Having said that, for a web company where performance is vital, New Relic can quickly pay for itself with reduced developer time spend on issues and fast alerting to performance related issues. Both operations and developers have found it valuable at work, and I’ve personally found this a much more useful tool than our Splunk account.
If you’re only interested in server monitoring you will probably find better value in a traditional Munin setup, unless you value the increased simplicity of configuration and maintenance.
Note that New Relic is also not a replacement for alert-monitoring such as Nagios – whilst New Relic can generate alerts for performance issues and other thresholds, my advice is to rely on Nagios for service and resource overload/failure and rely on New Relic monitoring for alerting to abnormal or negative performance trends.
I also found that I still find Awstats very useful – whilst New Relic has some nice browser stats and geography stats, Awstats is more useful for the “how much traffic and data has my website/application done this month” type questions.
It’s not for everyone’s requirements and budget, but I do highly recommend having an initial trial of it, whether you’re running a couple of servers or a massive enterprise.
Great server crash of 2012
In a twist of irony, shortly after boarding my flight in Sydney for my trip back to Wellington to escape the heat of the AU summer, my home NZ server crashed due to the massive 30 degree heatwave experienced in Wellington on Christmas day. :-/
I have two NZ servers, my public facing colocation host, and my “home” server which now lives at my parent’s house following my move. The colocation box is nice and comfy in it’s aircon controlled climate, but the home server fluctuates quite significantly thanks to the Wellington climate and it’s geolocation of being in a house rather than a more temperature consistent apartment/office.
After bringing the host back online, Munin showed some pretty scary looking graphs:
I’ve had problems with the stability of this system in the past. Whilst I mostly resolved this with the upgrades in cooling, there are still the odd occasions of crashing, which appears to be linked with summer months.
The above graphs are interesting since they show a huge climb in disk temperatures, although I still suspect it’s the CPU that lead to the actual system crash occurring – the CPU temperature graphs show a climb up towards 60 degrees, which is the level where I’ve seen many system crashes in the past.
What’s particularly annoying is that all these crashes cause the RAID 6 to trigger a rebuild – I’m unsure as to why exactly this is, I suspect that maybe the CPU hangs in the middle of a disk operation that has written to some disks, but not all.
Having the RAID rebuild after reboot is particularly nasty since it places even more load and effort onto an already overheated system and subjects the array to increased failure risk due to the loss of redundancy. I’d personally consider this a kernel bug, if a disk operation failed, the array should still have a known good state and be able to recover from that – fail only the blocks that are borked.
Other than buying less iffy hardware and finding a cooler spot in the house, there’s not a lot else I can do for this box…. I’m pondering using CPU frequency scaling to help reduce the temperature, by dropping the clock speed of the CPU if it gets too hot, but that has it’s own set of risks and issues associated with it.
In past experiments with temperature scaling on this host, it hasn’t worked too well with the high virtualised workload causing it to swap frequently between high and low performance, leading to an increase in latency and general sluggishness on the host. There’s also a risk that clocking down the CPU may just result in the same work taking longer on the CPU potentially still generating a lot of heat.
I could attack the workload somewhat, the VMs on the host are named based on their role, eg (prod-, devel-, dr-) so there’s the option to make use of KVM to suspend all but key production VMs when the temperature gets too high. Further VM type tagging would help target this a bit more, for example my minecraft VM is a production host, but it’s less important than my file server VM and could be suspended on that basis.
Fundamentally the host staying online outweighs the importance of any of the workloads, on the simple basis that if the host is still online, it can restart services when needed. If the host is down, then all services are broken until human intervention can be provided.
Munin 2.0.x on EL 5/6 with IPv6
I’ve been looking forwards to Munin 2 for a while – whilst Munin has historically been a great monitoring resource, it’s always been a little bit too fragile for my liking and the 2.x series sounds like it will correct a number of limitations.
Munin 2.0.6 packages recently became available in the EPEL repository, making it easy to add Munin to your RHEL/CentOS/OracleEL 5/6 servers.
Unfortunately the upgrade managed to break value collection for all my hosts, thanks to the fact that I run a dual-stack IPv4/IPv6 network. :-(
Essentially there were two problems encountered:
- Firstly, the Munin 2.x master attempts to talk to the nodes via IPv6 by default, as it typical of applications when running in a dual stack environment. However when it isn’t able to establish an IPv6 connection, instead of falling back to IPv4, Munin just fails to connect.
- Secondly, the Munin nodes weren’t listing on IPv6 as they should have been – which is the cause of the first problem.
The first problem is an application bug, or possibly a bug in one of the underlying libraries that Munin-node is using. I haven’t gone to the effort of tracing and debugging it at this stage, but if I get some time it would be good to fix properly.
The second is a packaging issue – there are two dependency issues on EL 5 & 6 that need to be resolved before munin-node will support IPv6 properly.
- perl-IO-Socket-INET6 must be installed – whilst it may not be a package dependency (at time of writing anyway) it is a functional dependency for IPv6 to work.
- perl-Net-Server as provided by EPEL is too old to support listening on IPv6 and needs to be upgraded to version 2.x.
Once the above two issues are corrected, make sure that the munin configuration is correctly configured:
host *
allow ^127\.0\.0\.1$
allow ^192\.168\.1$
allow ^fdd5:\S*$
I configure my Munin nodes to listen to all interfaces (host *) and to allow access from localhost, my IPv4 LAN and my IPv6 LAN. Note that the allow lines are just regex rather than CIDR notation.
If you prefer to allow all connections and control access by some other means (such as ip6tables firewall rules), you can use just the following as your only allow line:
allow ^\S*$
Once done, you can verify that munin-node is listening on an IPv6 interface. :-)
ipv4host$ netstat -na | grep 4949
tcp 0 0 0.0.0.0:4949 0.0.0.0:* LISTEN
ipv6host$  netstat -na | grep 4949
tcp 0 0 :::4949 :::* LISTEN
I’ve created packages that solve these issues for EL 5 & EL 6 which are now available in my repos – essentially an upgraded perl-Net-Server package and an adjusted EPEL Munin package that includes the perl-IO-Socket-Net package as a dependency.
Munin Performance
Munin is a popular open source network resource monitoring tool which polls the hosts on your network for statistics for various services, resources and other attributes.
A typical deployment will see Munin being used to monitor CPU usage, memory usage, amount of traffic across network interface, I/O statistics and more – it’s very handy for seeing long term performance trends and for checking the impact that upgrades or adjustments to the environment have made.
Whilst having some overlap with Nagios, Munin isn’t really a replacement, more an addition – I use Nagios to do critical service and resource monitoring and use Munin to graph things in more detail – something that Nagios doesn’t natively do.
Rather than running as a daemon, the Munin master runs a cronjob every 5minutes that calls a sequence of scripts to poll the configured servers and generate new graphs.
- munin-update to poll configured hosts for new statistics and store the information in RRD databases.
- munin-limits to highlight perceived issues in the web interface and optionally to a file for Nagios integration.
- munin-graph to generate all the graphs for all the services and hosts.
- munin-html to generate the html files for the web interface (which is purely static).
The problem with this model, is that it doesn’t scale particularly well – once you start getting a substantial number of servers, the step-by-step approach can start to run out of resources and time to complete within the 5minute cron period.
For example, the following are the results for the 3 key scripts that run on my (virtualised) Munin VM monitoring 18 hosts:
sh-3.2$ time /usr/share/munin/munin-update
real    3m22.187s
user    0m5.098s
sys     0m0.712s

sh-3.2$ time /usr/share/munin/munin-graph
real    2m5.349s
user    1m27.713s
sys     0m9.388s

sh-3.2$ time /usr/share/munin/munin-html
real    0m36.931s
user    0m11.541s
sys     0m0.679s
It’s a total of around 6 minutes time to run – long enough that the finishing job is going to start clashing with the currently running job.
So why so long?
Firstly, munin-update – munin-update’s time is mostly spent polling the munin-node daemon running on all the monitored systems and then a small amount of I/O time writing the new information to the on-disk RRD files.
The developers have appeared to realise the issue of scale with munin-update and have the ability to run it in a forked mode – however this broke horribly for me with a highly virtualised environment, since sending a poll to 12+ servers all running on the one physical host would cause a sudden load spike and lead to a service poll timeout, with no values being returned at all. :-(
This occurs because by default Munin allows a maximum of 5 seconds for each service query to complete across all hosts and queries all the hosts and services rapidly, ignoring any that fail to respond fast enough. And when querying a large number of servers on one physical host, the server would be too loaded to respond quickly enough.
I ended up boosting the timeouts on some servers to 60 seconds (particular the KVM hosts themselves, as there would sometimes be 60+ LVM volumes that Munin wanted statistics for), but it still wasn’t a good solution and the load spikes would continue.
There are some tweaks that can be used, such as adjusting the max number of forked processes, but it ended up being more reliable and easier to support to just run a single thread and make sure it completed as fast as possible – and taking 3 mins to poll all 18 servers and save to the RRD database is pretty reasonable, particular for a staggered polling session.
After getting munin-update to complete in a reasonable timeframe, I took a look into munin-html and munin-graph – both these processes involve reading the RRD databases off the disk and then writing HTML and RRDTool Graphs (PNG files) to disk for the web interface.
Both processes have the same issue – they chew a solid amount of CPU whilst processing data and then they would get stuck waiting for the disk I/O to catch up when writing the graphs.
The I/O on this server isn’t the fastest at the best of times, considering it’s an AES-256 encrypted RAID 6 volume and the time taken to write around 200MB of changed data each time was a bit too much to do efficiently.
Munin offers some options, including on-demand graph generation using CGIs, however I found this just made the web interface unbearably slow to use – although from chats with the developer, it sounds like version 2.0 will resolve many of these issues.
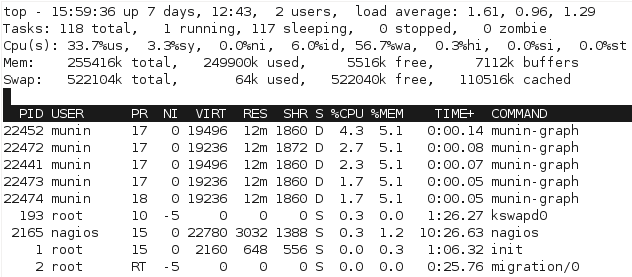
I needed to fix the performance with the current batch generation model. Just watching the processes in top quickly shows the issue with the scripts, particular with munin-graph which runs 4 concurrent processes, all of them waiting for I/O. (Linux process crash course: S is sleeping (idle), R is running, D is performing I/O operations – or waiting for them).
Clearly this isn’t ideal – I can’t do much about the underlying performance, other than considering putting the monitoring VM onto a different I/O device without encryption, however I then lose all the advantages of having everything on one big LVM pool.
I do however, have plenty of CPU and RAM (Quad Phenom, 16GB RAM) so I decided to boost the VM from 256MB to 1024MB RAM and setup a tmpfs filesystem, which is a in-memory filesystem.
Munin has two main data sources – the RRD databases and the HTML & graph outputs:
# du -hs /var/www/html/munin/
227M    /var/www/html/munin/

# du -hs /var/lib/munin/
427M    /var/lib/munin/
I decided that putting the RRD databases in /var/lib/munin/ into tmpfs would be a waste of RAM – remember that munin-update is running single-threaded and waiting for results from network polls, meaning that I/O writes are going to be spread out and not particularly intensive.
The other problem with putting the RRD databases into tmpfs, is that a server crash/power down would lose all the data and that then requires some regular processes to copy it to a safe place, etc, etc – not ideal.
However the HTML & graphs are generated fresh each time, so a loss of their data isn’t an issue. I setup a tmpfs filesystem for it in /etc/fstab with plenty of space:
tmpfs /var/www/html/munin tmpfs rw,mode=755,uid=munin,gid=munin,size=300M 0 0
And ran some performance tests:
sh-3.2$ time /usr/share/munin/munin-graph
real    1m37.054s
user    2m49.268s
sys     0m11.307s

sh-3.2$ time /usr/share/munin/munin-html
real    0m11.843s
user    0m10.902s
sys     0m0.288s
That’s a decrease from 161 seconds (2.68mins) to 108 seconds (1.8 mins). It’s a reasonable increase, but the real difference is the massive reduction in load for the server.
For a start, we can see from watching the processes with top that the processor gets worked a bit more to complete the process, since there’s not as much waiting for I/O:

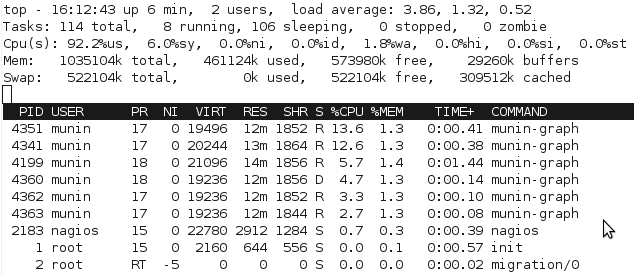 With the change, munin-graph spends almost all it’s time doing CPU processing, rather than creating I/O load – although there’s the occasional period of I/O as above, I suspect from the time spent reading the RRD databases off the slower disk.
Increased bursts of CPU activity is fine – it actually works out to less CPU load, since there’s no need for the CPU to be doing disk encryption and hammering 1 core for a short period of time is fine, there’s plenty of other cores and Linux handles scheduling for resources pretty well.
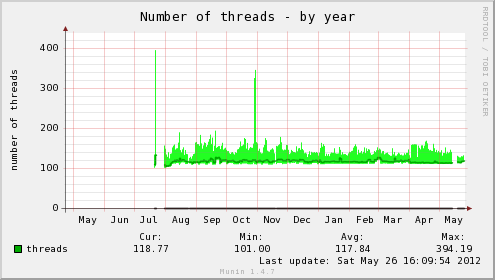
We can really see the difference with Munin’s own graphs for the monitoring VM after making the change:
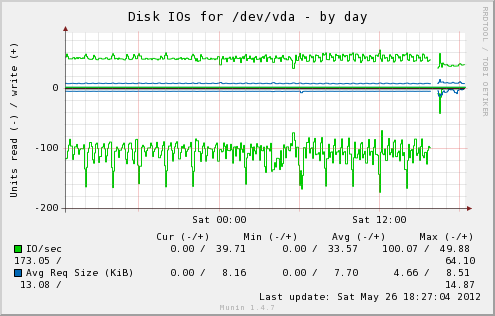
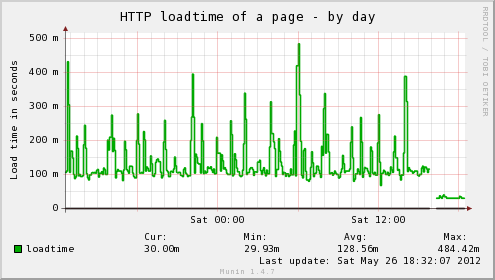
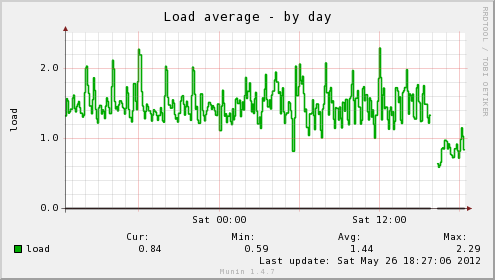 In addition, the host server’s load average has dropped significantly, as well as the load time for the web interface on the server being insanely fast, no more waiting for my browser to finish pulling all the graphs down for a page, instead it loads in a flash. Munin itself gives you an idea of the difference:
If performance continues to be a problem, there are some other options such as moving RRD databases into memory, patching Munin to do virtualisation-friendly threading for munin-update or looking at better ways to fix CGI on-demand graphing – the tmpfs changes would help a bit to start with.

